Debug Set Up
- Installation
- Help
- Learning Cmfive
- Introduction
- Creating A Config
- The Models Folder
- Install And Migrations
- Creating Index Action
- Creating Index Template
- Creating Item Action
- Add Item Table
- Edit Item Button
- Additional Configuration
Debug Set Up
Set up Debug in VSCode
The debug is a very useful tool. It allows you to look at, and see how all the code in a repository is connected right from Visual Studio Code.
To start, you need to install the correct extension.
Open Visual Studio Code and go to the extensions tab on the left. This looks like a set of four squares with the one on the top right slightly separated from the rest. In the search bar search for PHP Debug, and click the green install button on the extension. This may take a few minutes.
Once installed, you should see a new option in your left screen that looks like a play button with a small insect near the bottom left. This is the debug menu. Before it can be used however, you need a launch.json file. The boilerplate has one in a .vscode folder, and the Debug tool should start using this.
Now open the Debug menu. You should see several sections in this menu listed as VARIABLES, WATCH, CALL STACK, and BREAKPOINTS. This last section is the only one that should have information in it, and is the one that will be explained in this tutorial help page.
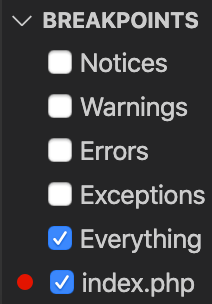
BREAKPOINTS will include the options Notices, Warnings, Errors, Exceptions, and Everything with checkboxes next to them. By default, Everything should be checked, and in most cases, this is what you will use.
To check a piece of code, you will need to create you own breakpoint. Let’s use our index.php file to practice. If you haven’t yet created one, follow the tutorial under the Learning Cmfive menu.
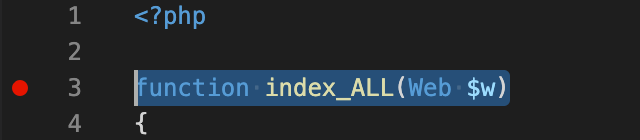
Go back to the explorer menu (picture of two pages laying on top of each other) on the left, and choose your index.php file. See line 3:
function index_ALL(Web $w)
Hover your mouse just in front of the numbers. You should see a red dot appear. Click this to make it permanent and return to the Debug menu.
 You should now see a sixth option under BREAKPOINTS labeled index.php/ This should also be checked.
To use the Debug hit the green play button nest to DockerLink at the top of your menu. Now reload your Example module in localhost. You will get an error once localhost hits the breakpoint you created. Now return to Visual Studio Code. By using the curved arrow you can step over your first line of code and see what will be loaded next by the browser. By using the arrow pointing down you can step into your code to see what the the function does. This will take you to the page your index_ALL function calls. By continually stepping in, you will see all the pages the browser looks at to load your function.
Once you are done, click the red stop button at the top of the docker menu. Remember to or remove/disable your break point.